
New RAP Dataset Provides Additional Functionality and Improved Vegetation Monitoring
New 10-meter datasets add increased functionality and accuracy to the Rangeland Analysis Platform.

Strong Conservation Team Helps Transform Historic Land into Quail, Monarch Habitat
August 20, 2025
Invasive Annual Grasses Threaten Mule Deer Habitat
September 2, 2025

Zoomed-in resolution on western rangelands helps landowners and managers plan conservation treatments and monitor outcomes with more confidence.
When the Rangeland Analysis Platform (RAP) was launched in 2018, the team that developed it knew it would revolutionize rangeland management.
For decades, the only way to do rangeland monitoring was to send armies of people out on the range with their heads down, clipping and counting vegetation all summer. While that type of field work and monitoring are still invaluable, the rangeland management community needed to move into the 21st Century. The Rangeland Analysis Platform was instrumental in making this move.

Today, rangeland managers, landowners, or anyone with a computer or smart device can access Rangelands.app to see rangeland vegetation types, view trends in rangeland production, and more. Even more impressive, users can go back in time to visualize and track changes.
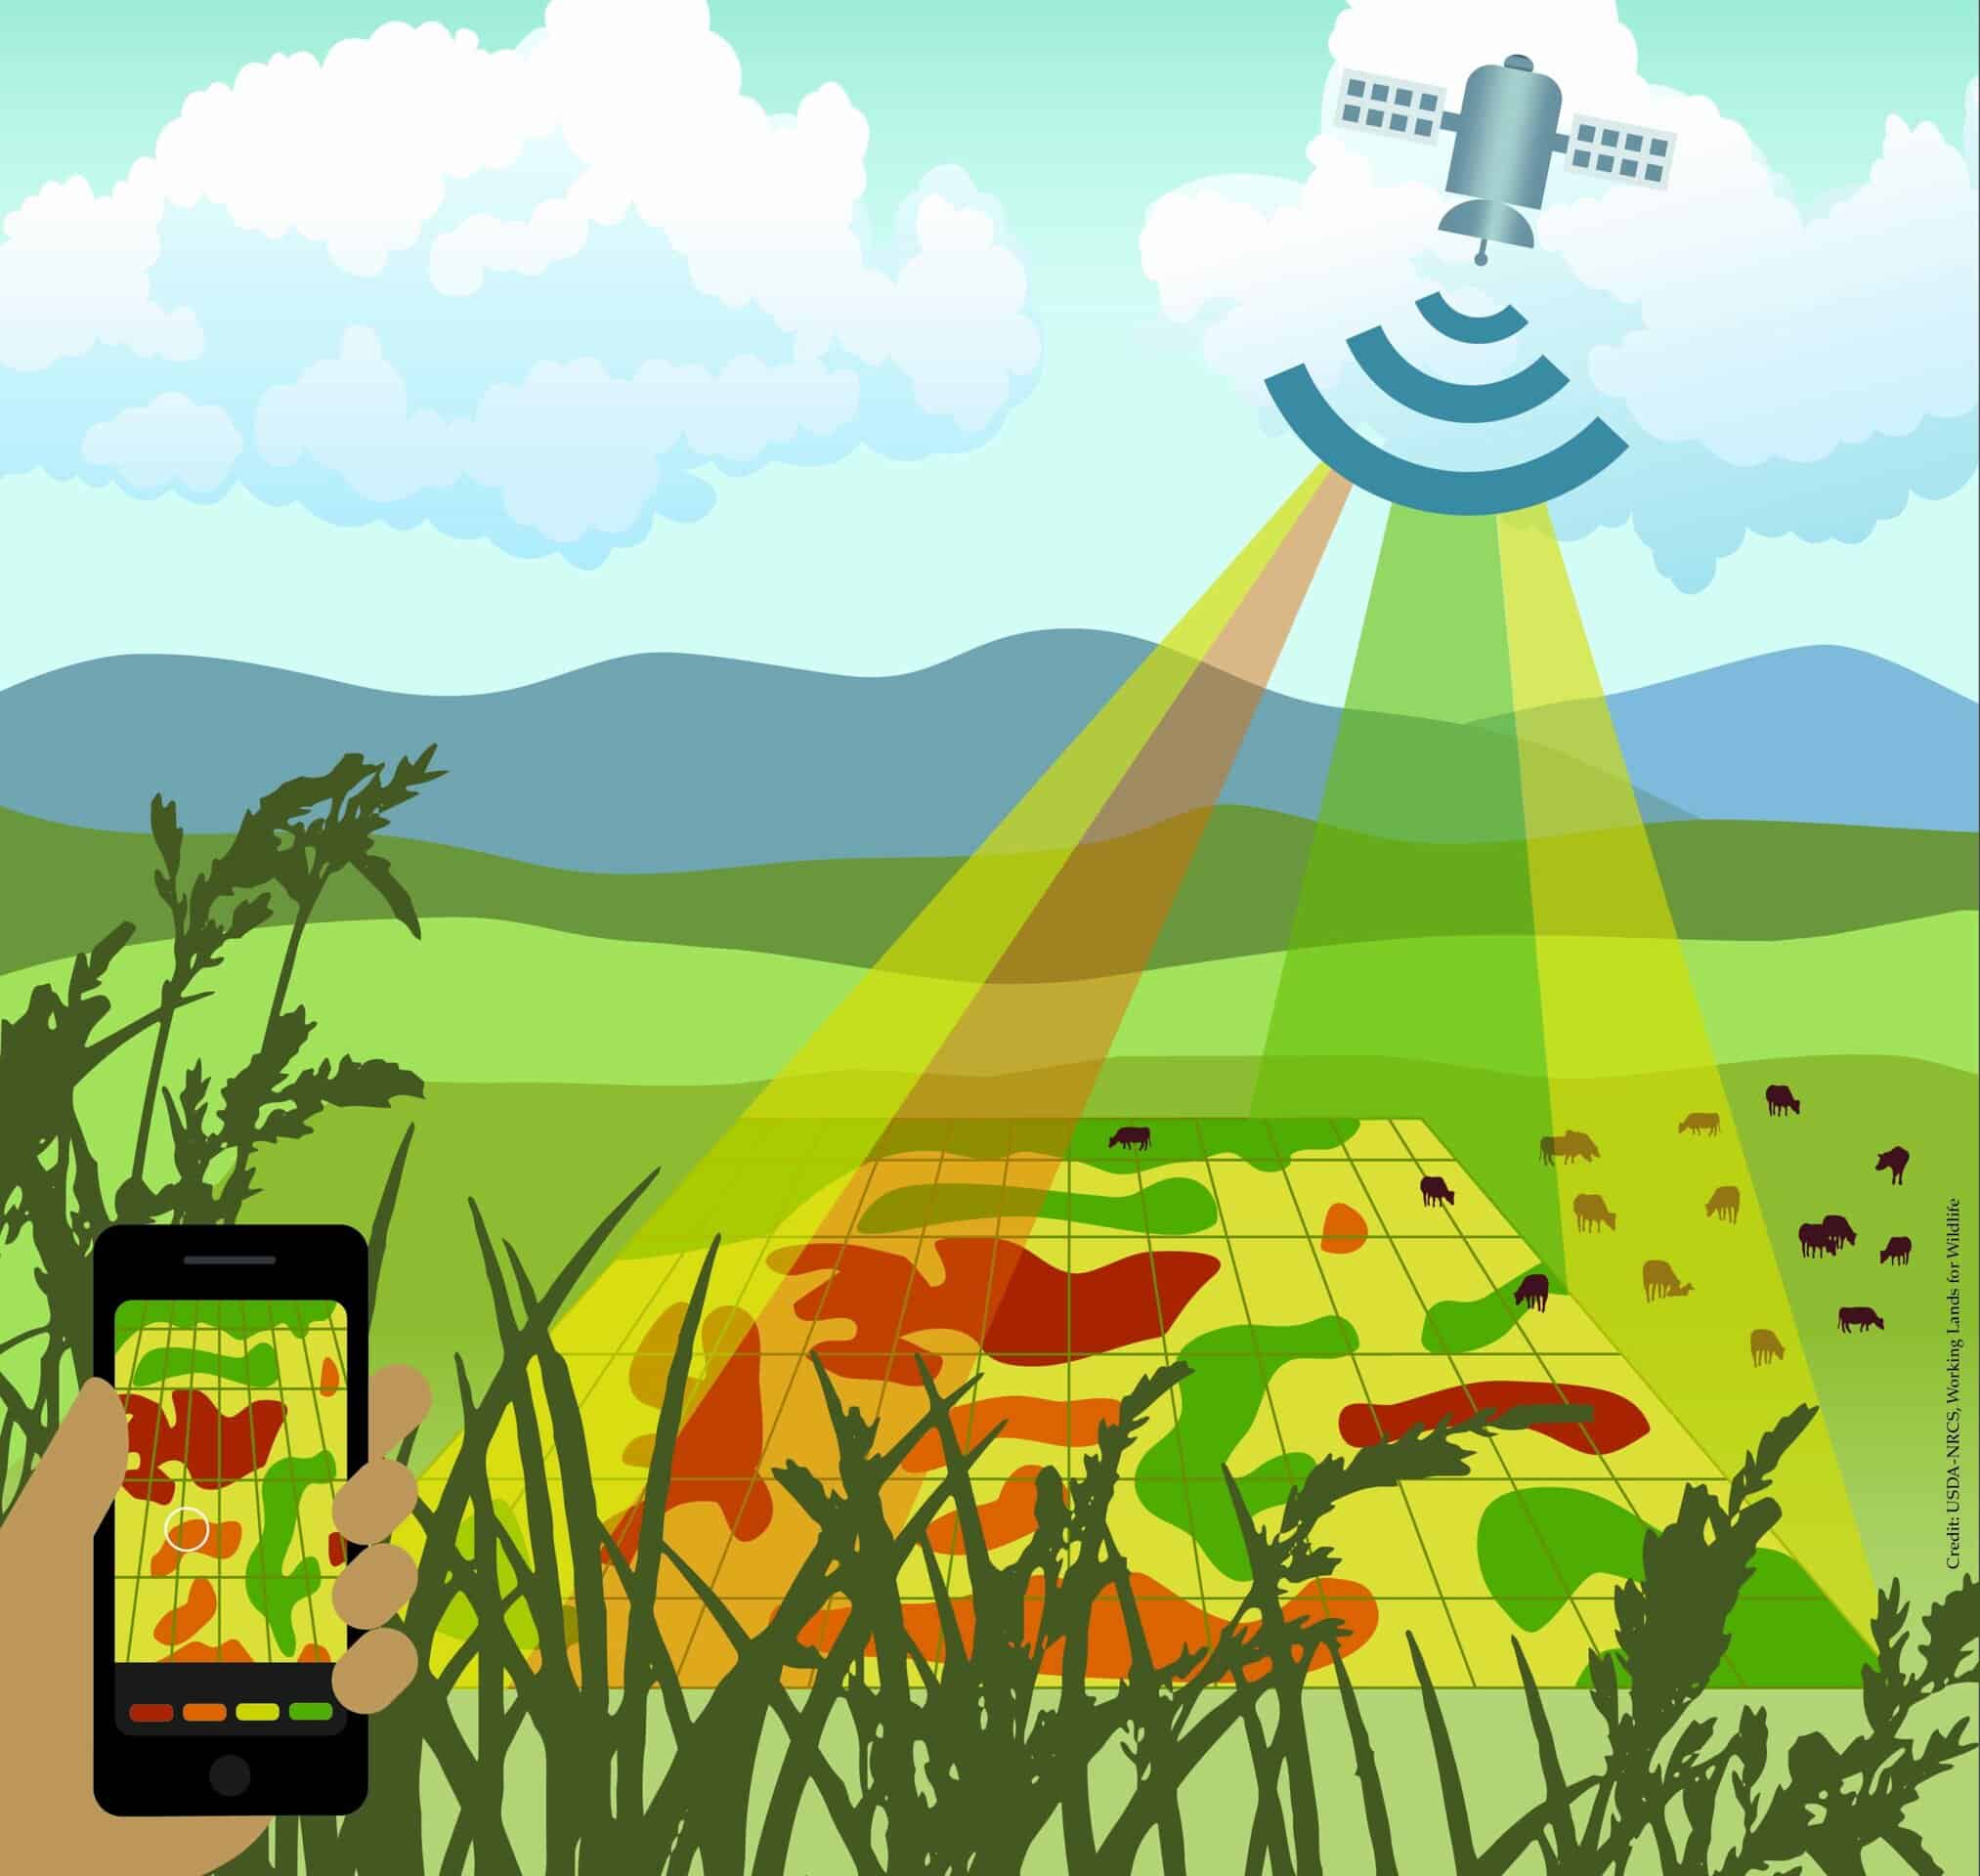
Now RAP has taken another giant leap forward. The USDA Agricultural Research Service recently announced the addition of a new 10-meter resolution rangeland vegetation cover dataset. These new data not only provide cover estimates at increased spatial resolution but also include the mapping of new species and greater accuracy in their estimates.
Previously, RAP provided vegetation cover data at a 30-meter scale across the continental U.S. This means it accurately predicts what type of vegetation is present on any given 30-by-30-meter plot (roughly the size of a baseball diamond) in the lower 48 states. RAP’s 30-meter datasets come from images taken by Landsat satellites, which orbit about 450 miles above Earth. The 30-meter datasets on RAP show five types of vegetation cover: annual forbs and grasses, perennial forbs and grasses, shrubs, trees, and bare ground.
Now, RAP also provides cover data at a 10-by-10-meter scale (roughly one-third the size of a tennis court), a major advancement for the platform. This is accomplished by using the Sentinel satellites that have higher resolution images and pass over Earth more frequently than the Landsat satellites. The 10-meter datasets provide the same five vegetation types while also adding invasive annual grasses, sagebrush, and pinyon-juniper trees to the mix. RAP can also now show canopy gap, or the amount of space between vegetation.

“This new functionality is a game changer for on-the-ground practitioners who need to see the land in finer detail,” says Jeremy Maestas, the sagebrush ecosystem specialist at the USDA-NRCS West Technology Center in Oregon and Working Lands for Wildlife core team member.
“Invasive annual grasses are the leading cause of sagebrush habitat degradation and conifer encroachment, including from pinyon-juniper trees, is the second-leading cause,” Maestas notes. “With these advances in the RAP, rangeland managers can better pinpoint where these threats are occurring, more confidently design treatment prescriptions, and reliably evaluate if their actions are working over time.”
The new, zoomed-in RAP datasets are especially suited for people analyzing smaller areas like a single grazing pasture or potential treatment area, or when land managers need to distinguish between certain vegetation types. Conversely, the RAP 30-meter datasets are helpful when people want to understand long-term trends across large areas, including whole watersheds or biomes.
“RAP is one of the most powerful tools I have at my disposal,” says Scott Morford, a researcher with the USDA-NRCS Working Lands for Wildlife team at the University of Montana. “The 10-meter datasets make it much easier to target conservation and evaluate outcomes at pasture scales. Whether tracking invasive grass treatments or conifer removal, this precision helps us better communicate at scales that matter for producers. And if I need historical context, the 30-meter data are still available.”
RAP is supported by a team of collaborators from the USDA’s Agricultural Research Service, Natural Resources Conservation Service, and Farm Service Agency, Bureau of Land Management, U.S. Fish & Wildlife Service, and the University of Montana.

