How Can Emerging Technology Help Conserve Rangeland?
Research scientist Dr. Matthew Jones explains how cloud computing and machine learning are changing the way we visualize and manage plants.
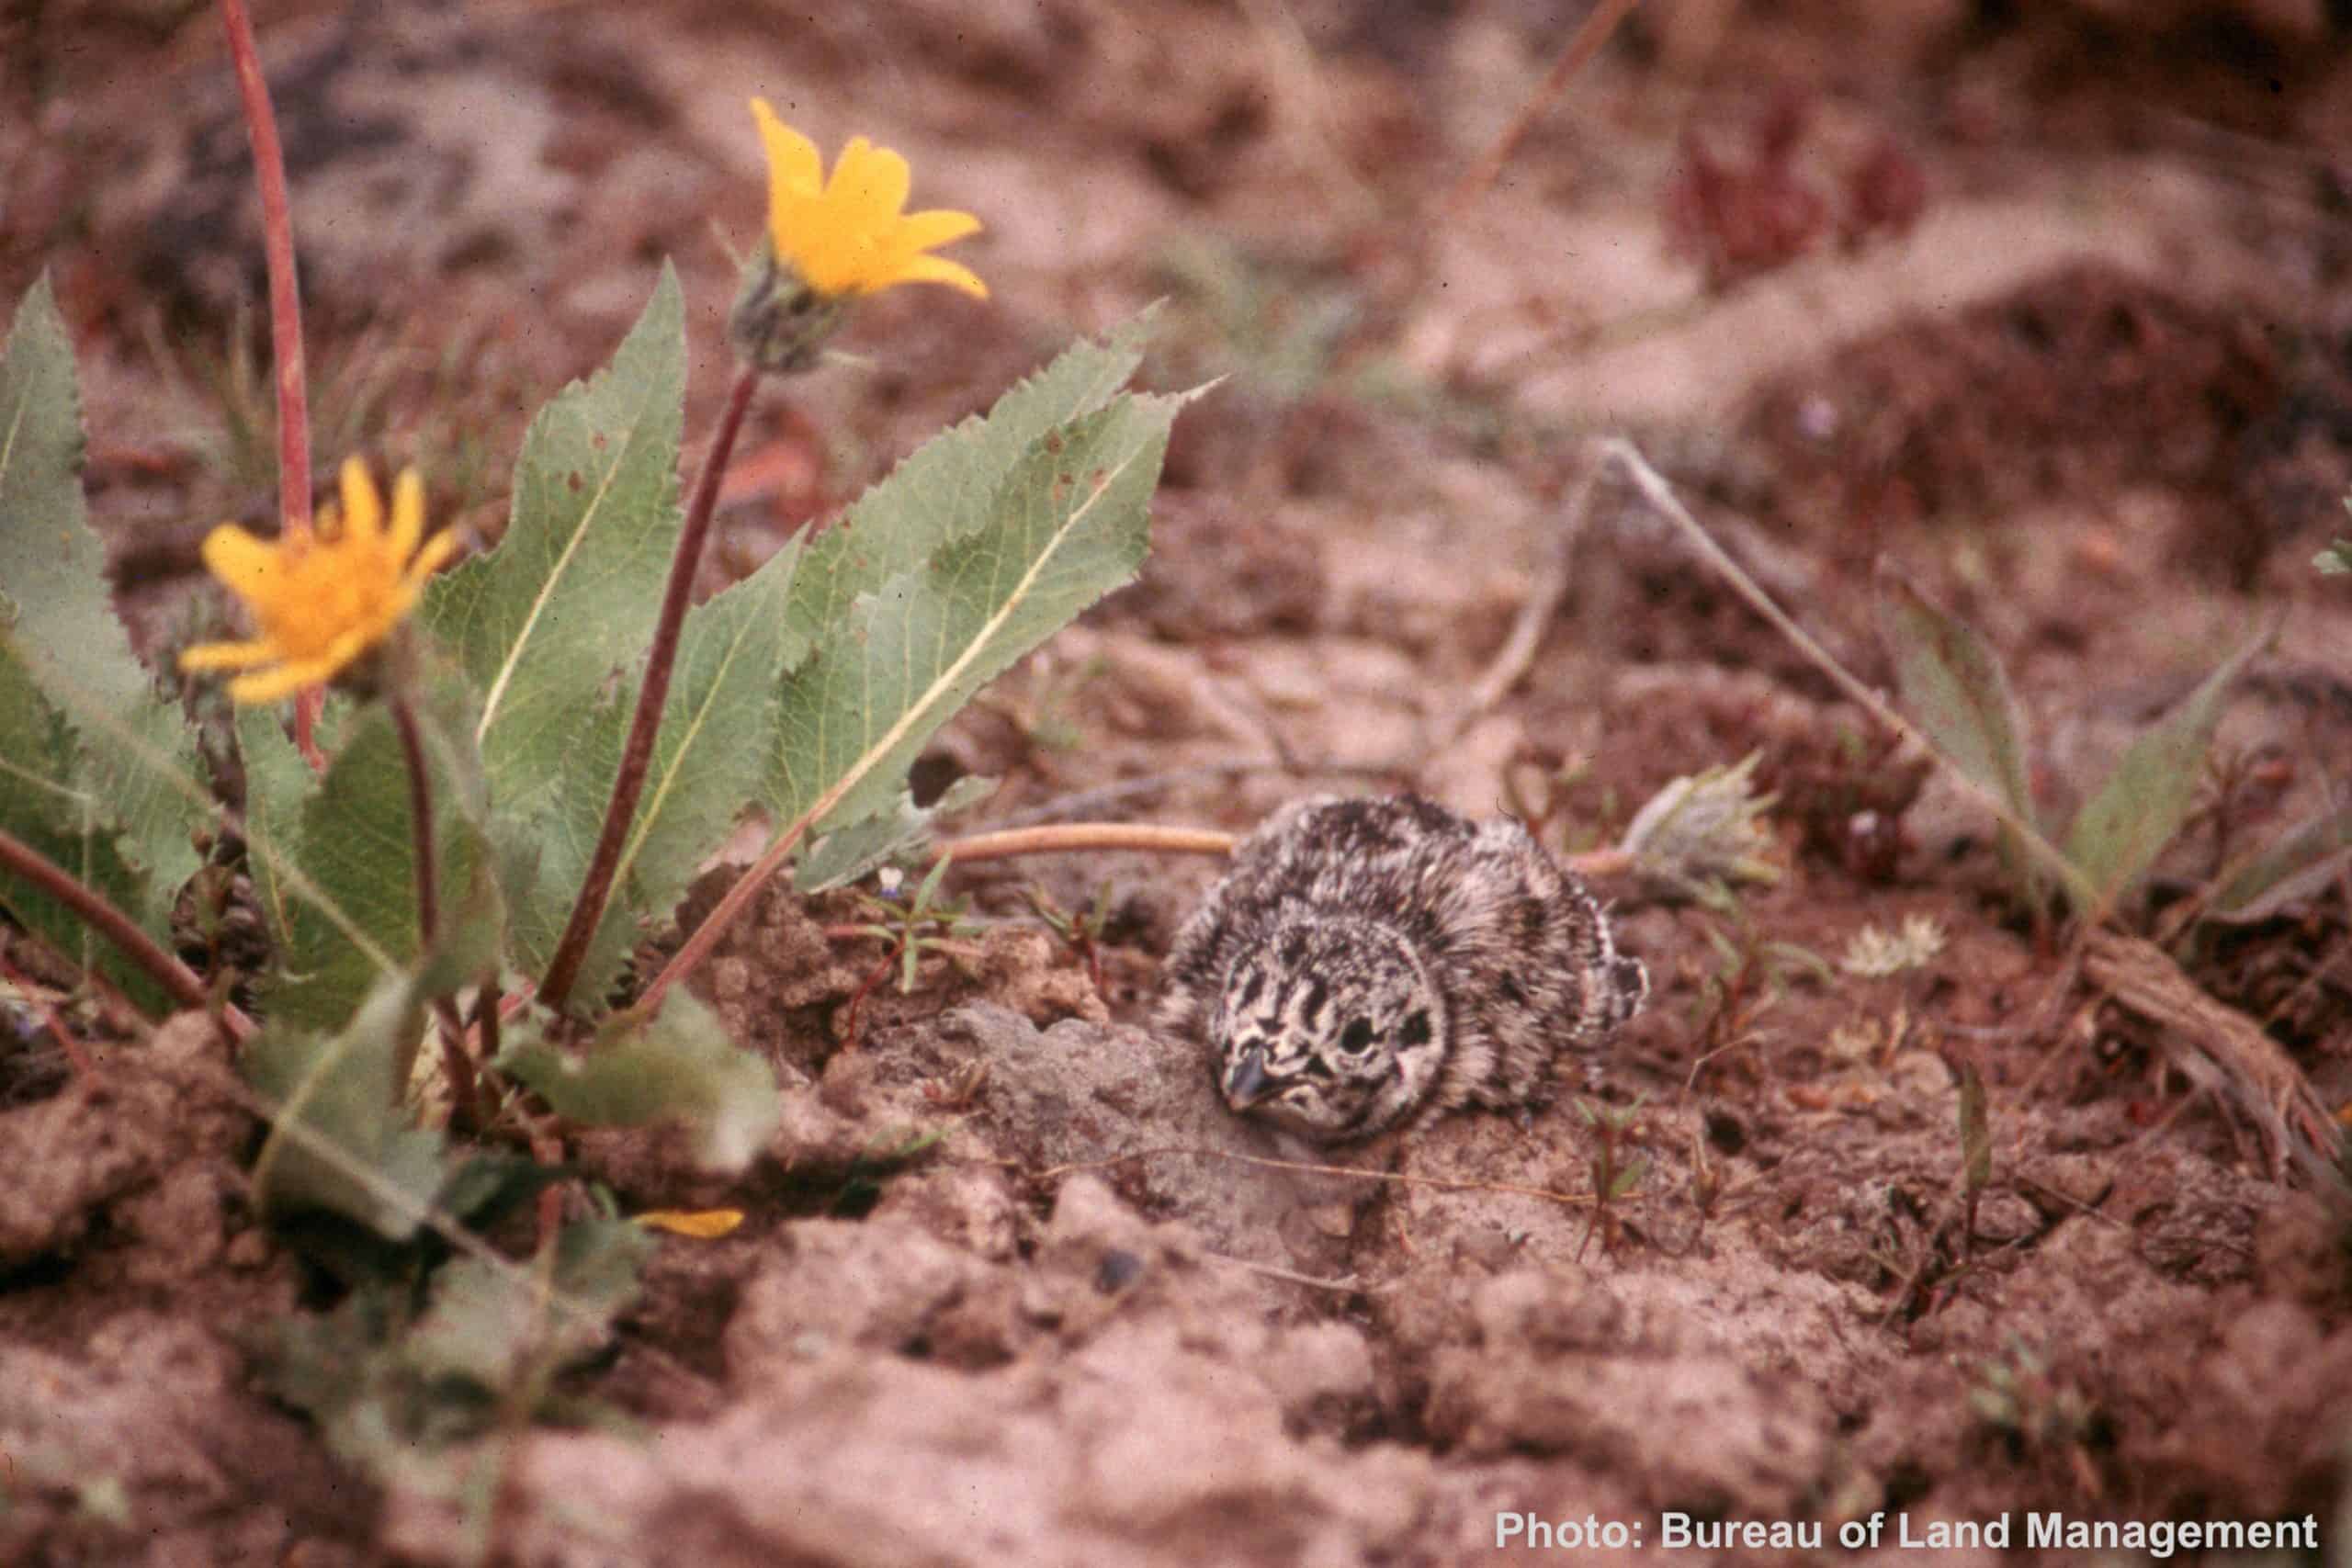
Grazed Rangelands Produce Sage Grouse Chicks’ Preferred Food
November 26, 2018
1,800 Ranchers and Counting!
December 18, 2018

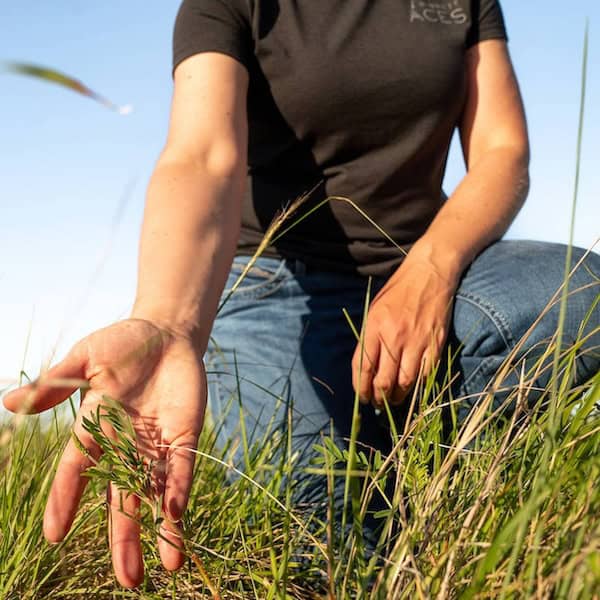
Gary Bedortha (left) and Chris Mundy of the NRCS take a close look at native plants prospering in the sagebrush steppe. (Stuebner photo)
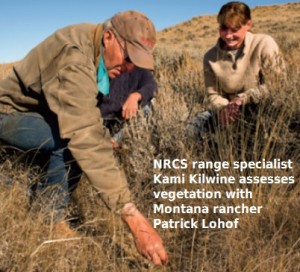
Thanks to the new Rangeland Analysis Platform, decades of on-the-ground vegetation data can be accessed quickly and easily to help conserve working lands. Photo: Steve Stuebner
Ask An Expert: Dr. Matthew Jones, Research Scientist, University of Montana
Why does monitoring plants matter?
In the western U.S. rangeland plants provide the foundation for a healthy ecosystem. In turn, this ecosystem provides the livelihood for hundreds of thousands of farmers and ranchers, and supplies food and resources for millions more people.
It’s important to efficiently and effectively monitor vegetation changes over time to ensure rangelands are productive and that we conserve these valuable resources.
For instance, it’s really critical to know if ranches or public lands are transitioning from nutritious forage like native perennials to annual invasive grasses that don’t sustain livestock or wildlife.
How do we collect information on rangeland vegetation?
For the last several decades, field technicians from the USDA Natural Resources Conservation Service (NRCS) and the Bureau of Land Management (BLM) have collected on-the-ground data on the type and abundance of plants at tens of thousands of field plots across the West.
While these field plots are critical for monitoring, they are only a snapshot and do not provide a big-picture view of overall vegetation cover through time. Until recently, it’s been a challenge to monitor vegetation over multiple years and across large landscapes—including the sizable ranches managed by many western agricultural producers.

Gay Austin, BLM, and others monitor vegetation at Wolf Creek in southwest Colorado. Photo: Renée Rondeau/CNHP
Is there a better way to monitor rangelands?
 Yes! It’s called the Rangeland Analysis Platform (RAP), a free user-friendly web app that—for the first time ever—allows anyone to quickly see trends in rangeland vegetation over both time and space.
RAP utilizes a combination of innovative technology to provide annual percent cover maps at 30m resolution—roughly the size of a baseball diamond—and depicts changes in vegetation over time. This revolutionizes our ability to monitor and manage valuable grazing lands.
How is RAP revolutionary?

RAP is the only platform that provides a view of vegetation across space, from the Great Plains to the Pacific Ocean, and time, from 1984-present, all at a resolution useful for monitoring and management. For every 30m pixel across the West, RAP shows the percent cover of five different vegetation types: annual forbs and grasses, perennial forbs and grasses, shrubs, trees, and bare ground. People can see vegetation cover at a broad watershed scale, or zoom into any area of interest, such as a ranch or pasture.
RAP and the land cover maps are a huge leap in technology. Before this free, easy-to-use tool, we only had cumbersome categorical static maps of vegetation for certain areas, which were produced every five years, not annually. While valuable those maps didn’t provide the mix of vegetation types over an area—a critical component if you want to see if conifers were taking over a ranch, or if annual grasses were beginning to invade your pasture.
Now RAP now gives everyone all of that information in less than one minute with a couple clicks on the computer.
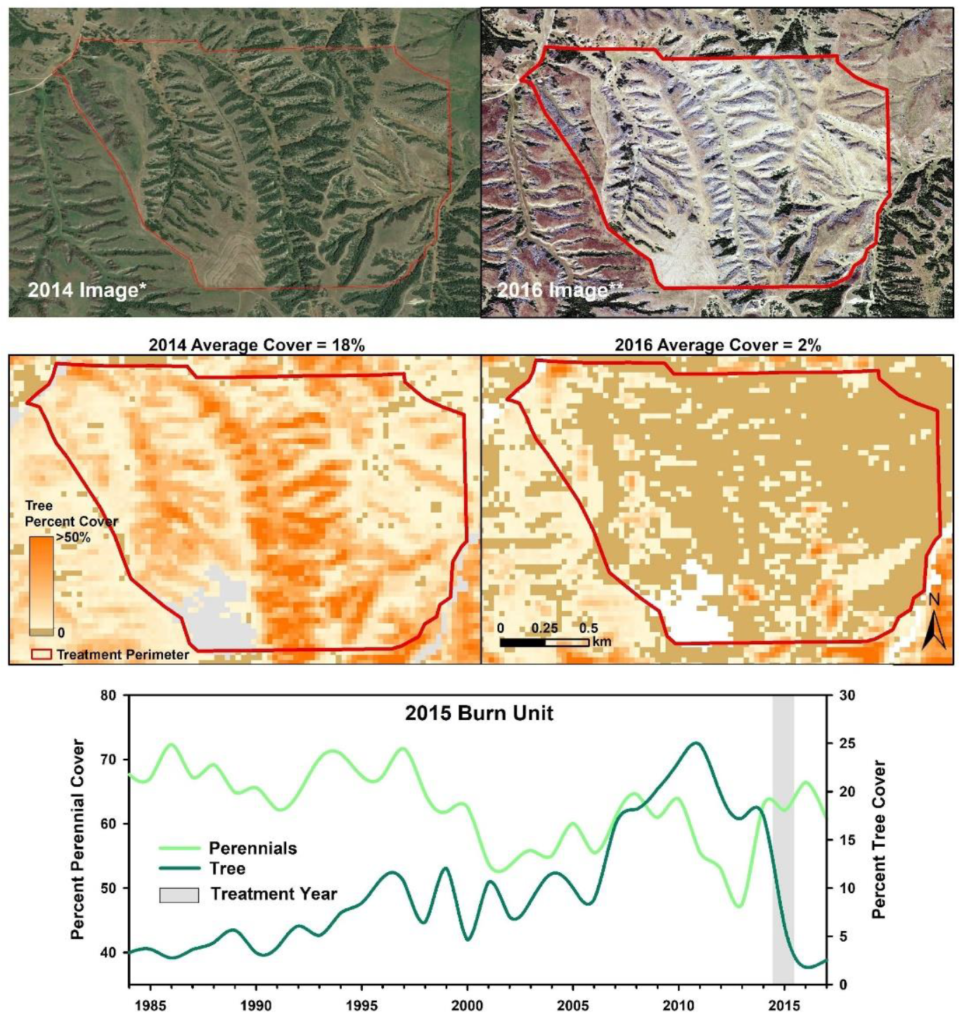
Top: Aerial photography shows tree cover in the Loess Canyons of Nebraska in 2014 (Image: Google Earth) and 2016 (Image: USDA NAIP). Middle: RAP-produced maps calculating the percent cover of trees pre- and post-burn within the treatment boundary (red polygon). Lower: Time series of mean perennial forb and grass as well as tree cover from 1984 to 2017 within the burn boundary (gray bar in 2015 denotes treatment year).
What technology does the Rangeland Analysis Platform use?
Working with the NRCS and BLM, we created RAP by using over 30,000 field plots and over three decades of Landsat satellite imagery, gridded climate data, and other land surface information like elevation and soil types.
In order to process and analyze this massive amount of information—the Landsat data is comprised of over 231,000 images alone!—we’re using the geospatial cloud computing power of Google Earth Engine.
Until now, gathering and processing an amount of data that large was simply not feasible, but with this new cloud computing technology we were able to harness all that data and make major strides for mapping rangeland plants.
To make the maps, we used a well-established machine learning algorithm—known as Random Forests—to make sense of this large collection of data. Random Forests examined the patterns, trends, and relationships between all of the data to create a model, or equation, that makes predictions of vegetation cover in areas where no field plots exist.
The result: online maps of five different types of land cover from 1984 to present.

Maps produced by the Rangeland Analysis Platform show the percent vegetation cover estimates of five different types of ground cover, as well as a composite map for three vegetation classes.
Why is this monitoring technology helpful?
By pairing the maps and time-series charts produced by RAP with local on-the-ground knowledge, ranchers and land managers can quickly see outcomes of past land management actions to help inform future decisions.
For instance, you could compare the impacts of a drought year and a wet year on perennial forage. Or you can evaluate how much cheatgrass expanded after a wildfire. Or you could plan future conifer removal projects by checking out where trees have encroached into shrublands over the last decade.
In a nutshell, RAP can help all of us sustain or improve the plants that are the backbone of America’s rangelands.
How reliable are these maps?
First off, any sort of model is going to have errors associated with it, since it’s making predictions. However, the maps and charts provided through RAP have comparable or lower error rates than any other vegetation maps created to date.
When using RAP, people should think of the percent cover values as best estimates. So, if you’re looking at your pasture’s cover for 2017 and RAP calculates it was 35% annual forbs and grasses, then you should use the mean absolute error for that type of cover as the range around that estimate. In other words, annual forb and grass cover has a mean error of 7.8%, which means you can be confident the annual forbs and grass cover in your pasture was between 27.2% and 42.8% (35% plus or minus the 7.8% error).
Check out this RAP User Guide to learn more.

The errors in Table 1 provide an assessment of accuracy. For instance, if the vegetation cover value of a mapped area is 35% annual forbs and grasses, then there is confidence that the annual forb and grass cover of that pixel is between 27.2% and 42.8% (35% +/- the mean absolute error of 7.8%).
Will the Rangeland Analysis Platform be expanded?
We’ll update the online app every year with the new land cover maps…the 2018 maps will be available by approximately February 2019.
We’re also working on incorporating plant productivity data into RAP. This would combine percent land cover with the plant productivity of that pixel, giving estimates of the amount of growth of each type of vegetation during any given year within your area of interest.
This has never been done before and will be another huge leap forward in monitoring technology. Plant production is the basic building block of ranch planning across the West. Our goal is to empower land managers with even more information for planning effective conservation projects.
Meet The Expert
Why did you choose remote sensing science and ecology as your career?

The combination of remote sensing (using satellite or airborne imagery) and ecology gives a comprehensive view across space and time that you simple can’t get with ground observations. And over the last decade, with advances in remote sensing and processing technology, our understanding of natural systems has evolved as never before. This type of technology allows everyone—even those who aren’t able to get out on specific parcels of land—to see how ecosystems are faring as well as determine the effects of our actions across the landscape.
How else have you applied your skills?
Just out of college I learned how to use airborne imagery to track the spread of blister rust on whitebark pine trees in Yellowstone National Park, which got me hooked on using remote sensing for ecology research. After getting my Master’s degree, I went on to work at Carnegie’s Department of Global Ecology where I used remote sensing to track invasive species and canopy biodiversity in Hawaiian rainforests.
I also worked as a member of the Landscape Ecology Team at the National Marine Fisheries Service, where I helped monitor the landscapes that influenced salmon runs. I then returned to the University of Montana to earn a Ph.D. in Systems Ecology by focusing on using remote sensing data to monitor and model vegetation.
In addition to serving on the USDA-NRCS Working Lands For Wildlife science team, I’m also a science advisor to NASA and NEON (National Ecological Observatory Network) working groups.
 What do you do in your free time?
I enjoy the outdoors in Missoula, Montana where I live by fly fishing, hiking, biking, snowboarding, and playing soccer. At least I try to do those things as much I can, given that now much of my time is spent playing games in the backyard with my three and five year-old kids. Luckily, I’ve already got my five-year-old fishing and skiing, so that’s a start!
Read the article in Ecosphere >
New Technology For Landowners And Resource Managers Revolutionizes Rangeland Monitoring
SGI Unveils Interactive Web Application To Bolster Wildlife Conservation Work