
New Online Tool Shows Songbird Abundance Across Sagebrush Country
Check out the latest map additions to the SGI Web App, which allow users to easily visualize songbird distribution, bolstering multi-species conservation across the American West.
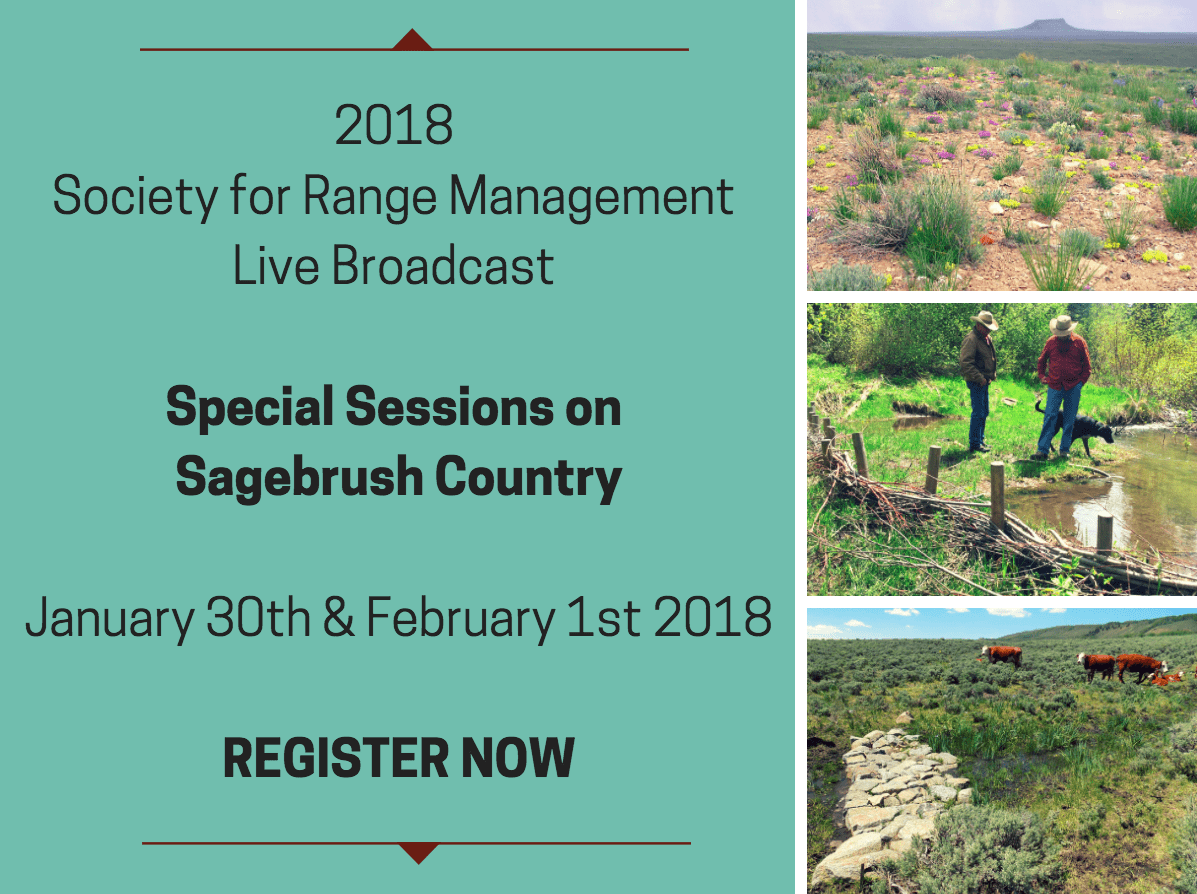
Free Live-Broadcast of Special Symposia from Society for Range Management Conference
January 12, 2018
Why Is Cheatgrass Bad?
January 30, 2018
Map additions to the SGI Web App allow users to easily visualize songbird distribution, bolstering multi-species conservation across the American West
View the new Songbird Abundance maps
 The sweet trill of songbirds provides a musical backdrop across sagebrush country. These unique songs do more than make us smile — they also serve as barometers for the health of the range.
From warblers and flycatchers to jays to sparrows, songbirds are adapted to live in specific ecological niches across the vast American West. Some need sagebrush. Others need woodlands. The abundance and diversity of songbirds across a specific region gives us a glimpse as to how the ecosystem is faring.
The Sage Grouse Initiative and our partners are proud to announce the release of the newest component of the SGI Interactive Web App, called the Songbird Abundance layer. These custom maps represent the predicted abundance of nine species of sagebrush- and woodland-obligate songbirds within the U.S. distribution of sagebrush-steppe ecosystems.
“Songbirds are part of the conservation portfolio in the sagebrush steppe,” says Jason Tack, a wildlife biologist with the U.S. Fish and Wildlife Service Habitat and Population Evaluation Team who helped create this new layer. “Now these new data layers will help our partners better target management for the benefit of songbirds.”

The new Web App layer shows the abundance of 9 songbird species across the West. This zoomed-in screenshot shows pinyon jay abundance in Nevada and Utah.
SGI’s Web App is one of the science-based tools that helps resource managers and our partners make good decisions for both working lands and wildlife. This free, online mapping platform runs on Google Earth Engine, allowing the public to easily visualize, analyze, and share resource data across the 11-state range of sage grouse.
The NRCS-led Sage Grouse Initiative and our many public and private partners focus on conserving habitat for sage grouse. But we also recognize that what’s good for this big upland bird benefits 350 species that depend on healthy, intact sagebrush country — including its smaller relatives, songbirds.
The new songbird abundance maps aim to bolster multi-species conservation across the American West. The innovative new songbird mapping tool — created by the U.S. Fish and Wildlife Service’s Habitat and Population Evaluation Team & Science Applications with the support of the Western Association of Fish and Wildlife Agencies Sagebrush Science Initiative — will help partners target conservation practices to benefit declining songbird populations.
Long-Term Population Trends for Songbirds Featured on the SGI*
| SAGEBRUSH SPECIES | |
| Brewer’s Sparrow | Declining |
| Sage Thrasher | Declining |
| Green-tailed Towhee | Declining |
| Sagebrush Sparrow | Neutral |
| WOODLAND SPECIES | |
| Juniper Titmouse | Increasing |
| Ash-throated Flycatcher | Increasing |
| Gray Flycatcher | Increasing |
| Gray Vireo | Neutral |
| Pinyon Jay | Declining |
*Based on data from the Breeding Bird Survey, a citizen-science effort that’s been conducted across the U.S. annually since 1966.
Ecosystem-level restoration requires looking at the big picture of how habitat supports a diversity of wildlife species. For instance, we know that removing invading conifers from rangelands benefits sage grouse. We also know that the abundance of Brewer’s sparrow and green-tailed towhee increased 55% and 81%, respectively, following mechanical removal of conifer.
However, conservationists are also interested in assessing how removing conifers impacts species that rely on woodlands, such as the pinyon jay. The new songbird abundance models on the SGI Web App can help target conifer removal projects away from areas important for declining pinyon jays, while still offering benefits to imperiled sagebrush-dependent birds, like the sage grouse, Brewer’s sparrow, sage thrasher, and green-tailed towhee.

Find out more about the rangewide abundance of the sage thrasher and 8 other species at map.sagegrouseinitiative.com
Maps are based on models that use point count data from the Breeding Bird Survey, a citizen-science effort that’s been conducted across the U.S. annually since 1966. Bird counts, an index of abundance, were modeled using features such as land cover, time-stamped fire history, topography, and weather and climate variables.

Brewer’s sparrows depend on healthy wide-open sagebrush country, and are declining in number. Photo: Wikipedia Commons
Previously, the models developed for sagebrush-obligate songbirds summarized data across large-scale areas, resulting in coarse predictions. The maps on the SGI Web App were updated using citizens’ bird count data, allowing for high-resolution predictions at a finer, site-specific scale.
“The partnership between FWS, SGI, and WAFWA, demonstrates how effective we can be as a collaborative team in creating the science and getting it into the hands of those people who need it most,” says Tack.
Like all of the big-picture data presented on the SGI Web App, it’s important to note that the maps are large-scale model representations. On-the-ground conservation is most effective by pairing this visualized data with local, site-specific knowledge of natural resources.
We appreciate the many partners who contributed to this new science-based conservation delivery tool. Keep us posted on how the songbird abundance map helps inform on-the-ground actions near you that benefit birds, other wildlife, and rangelands, too!
View the new songbird abundance maps on the SGI Web App >


